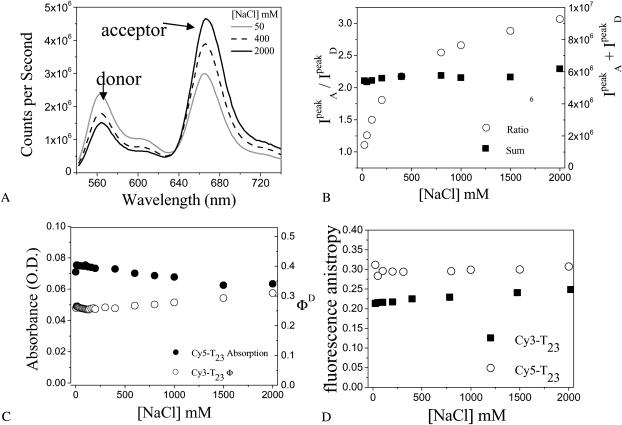
FIGURE 2.
FRET changes a function of [NaCl] reflect changes in average distance. (A) Bulk solution fluorescence emission spectra of 20 nM dT23 for several [NaCl]. Anticorrelated behavior is seen between the donor and acceptor intensities as the [NaCl] is changed. (B) The total intensity,  , does not vary much with [NaCl]; however their ratio,
  , increases with [NaCl] more drastically indicating changes in FRET. (C) Quantum yield (ΦD) of Cy3-dT23 and absorbance of Cy5-dT23 (170 nM) at various [NaCl]. (D) Anisotropy of Cy3-dT23 and Cy5-dT23 at various [NaCl].

