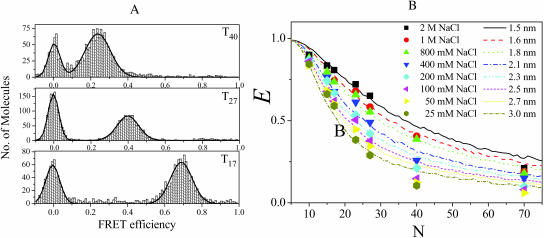
FIGURE 3.
(A) Single-molecule FRET efficiency histograms for dT17, dT27, and dT40 in 200 mM NaCl. The peaks at FRET ∼0 are due to DNA molecules possessing inactive Cy5, whereas the other peaks are due to FRET. Also shown are the fits to Gaussian curves. The widths of the histograms are within the measurement noise. (B) Average FRET efficiencies determined for a variety of tail lengths, N (10–70), and [NaCl] (from 25 mM to 2 M). The lines are simulations using the worm-like chain model with indicated persistence lengths, ranging from 1.5 nm to 3 nm.

