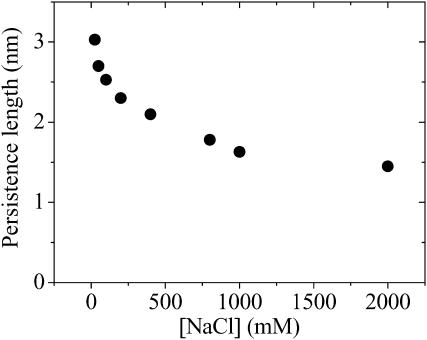
FIGURE 5.
Persistence length decreases with increasing salt concentration. The graph shows the persistence lengths versus [NaCl] determined by fitting the experimental data to the worm-like chain model. It was assumed that the distance between the two fluorophores can change via random walk with an elementary step size of 5.5 Å every one-hundredth of the donor lifetime.

