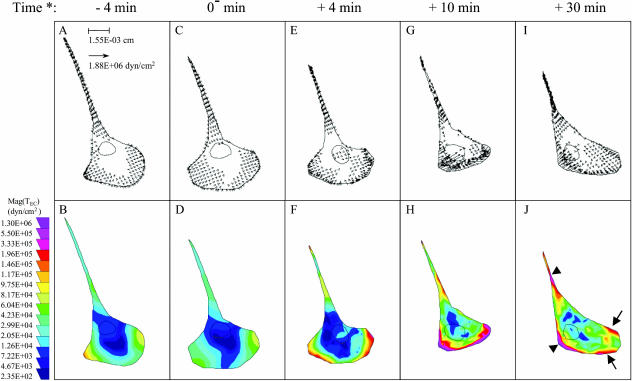
FIGURE 4.
Representative EC traction maps. Traction maps of an EC before (A–D) and after (E–J) exposure to fluid shear stress at 12 dyn/cm2. Distributions of tractions are shown as vector maps (upper panel) and as color images after converting the magnitude of tractions, mag(TEC), into color codes (lower panel) as described. Flow direction was from left to right. (*) Time relative to the start of flow. Arrows (←) and arrowheads (◂) in J point to the edge of the advancing front and the area of detachment, respectively (see text for details).

