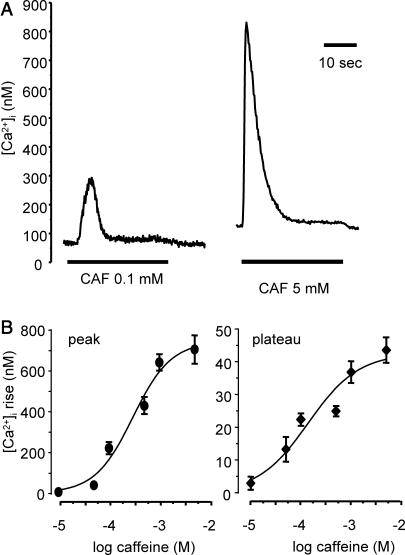
FIGURE 1.
Effect of various caffeine concentrations on [Ca2+]i responses. (A) Original traces of calcium response to 0.1 mM (left trace) and 5 mM (right trace) CAF (30-s stimulation). (B) Amplitude of the calcium peak (•, left panel) and plateau (♦, right panel) for CAF concentrations from 0.01 mM to 5 mM. Each point is a mean value from 10 to 35 cells. Vertical bars are SE.

