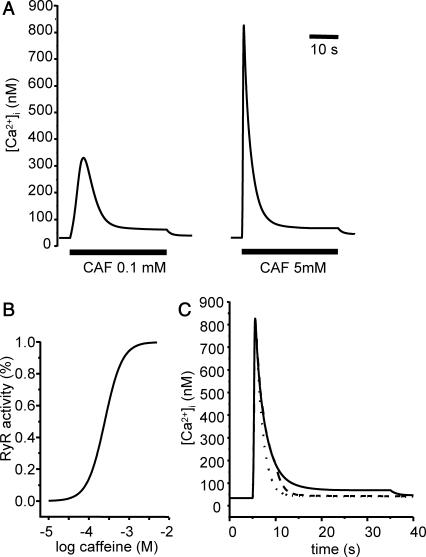
FIGURE 4.
Simulation of Ca2+ response to caffeine. (A) Simulated response to 0.1 (left) and 5 (right) mM CAF for 30 s. (B) Concentration-activity curve of RyR. (C) Simulated responses to 30-s (solid line), 5-s (dashed line), and 1-s (dotted line) caffeine (5 mM). Parameter values are ρSR = 0.01; ρm = 0.01; βSR = 0.0025; βm = 0.0025; Catot = 50 μM; SPrtot = 90 μM; BPrtot = 120 μM; Mgi = 500 μM; kRyR = 2000 s−1; kSERCA = 1 μM s−1; kleak = 0.02 s−1; kin = 20 μM s−1; kout = 0.1 s−1; kon = 0.1 μM−1 s−1; koff = 0.01 s−1; KCaff = 250 μM; KA,Ca = 2.5 μM; KA,Mg = 75 μM; KI,Ca = 400 μM; KI,Mg = 300 μM; KSERCA = 0.1 μM; Km = 1 μM; and KSPr = 5 μM.

