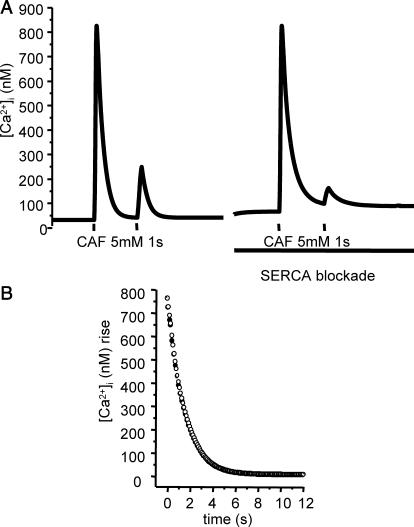
FIGURE 6.
Model prediction of the effect of SERCA blockade on the Ca2+ response to two successive stimulations by 5 mM caffeine (1 s). (A) Predicted [Ca+]i response to two successive 1-s stimulations by 5 mM CAF at a 15-s interval, with active (left trace) and inactivated (right trace) SERCA. (B) Predicted values of the decay phase after the first [Ca+]i rise, with active (•) and inactivated (○) SERCA. Parameter values are the same as in Fig. 4.

