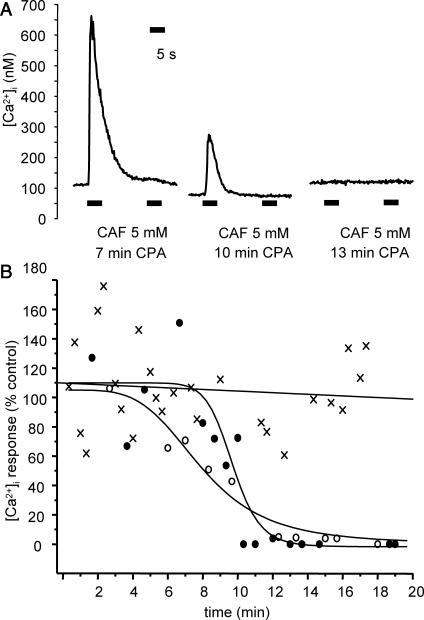
FIGURE 8.
Effect of SERCA blockade on SR Ca2+ load. (A) Typical traces of [Ca2+]i response to two successive 5-s CAF stimulations in cells preincubated with 10 μM CPA for 7 min (left trace), 10 min (middle trace), and 13 min (right trace). (B) Individual Ca2+ response to 5 mM CAF of cells incubated in Ca2+-free medium (crosses) and incubated in Ca2+-free medium with 10 μM CPA (•) or with 1 μM TG (○). Abscissa: duration of incubation. Ordinate: first peak amplitude in percent of control, i.e., response of cells in normal PSS. [Ca2+]i in Ca2+-free medium are fitted by linear regression; [Ca2+]i responses in the presence of CPA and TG are fitted by a sigmoidal equation.

