FIGURE 1.
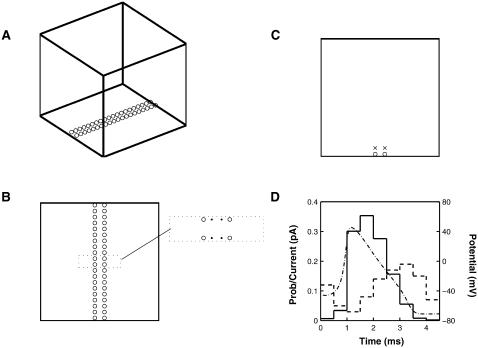
Geometry for the Monte Carlo simulation. (A) The simulation takes place in a cubic box with a side length of 1 μm. The presynaptic membrane is represented by the base where vesicles, represented by circles, are placed in an array consisting of two parallel lines in the central area; the low-affinity calcium sensor molecule is taken to be at the position of the vesicle. Calcium pumps are placed on all six walls. (B) Shows the placement of vesicles (○) and calcium channels (•) on the presynaptic membrane. The 80 vesicles are in two lines 80 nm apart; the 80 calcium channels are also in two parallel lines 30 nm apart, thus giving a minimum channel-vesicle separation of 25 nm (see dotted box). (C) A cross section of the terminal perpendicular to the presynaptic membrane, showing the placement of a high-affinity calcium sensor molecule (×) at a distance of 100 nm directly above each vesicle (○). (D) Shows the single-channel current and mean open times for a Ca2+ channel. The time course of the Hodgkin-Huxley impulse for a temperature of 6.3°C (dot-dashed line; right scale in mV) is subdivided into nine intervals each of length 0.5 ms. In each subinterval the dashed line gives the single-channel current (left scale in pA) and the solid line gives the probability that a given channel is open (left scale). The single-channel current is based on Delcour et al. (1993) and has been adjusted to allow for the fact that a channel may not be open for all of a subinterval. (See Table 1 in Bennett et al. (2000b) and the discussion surrounding it.)

