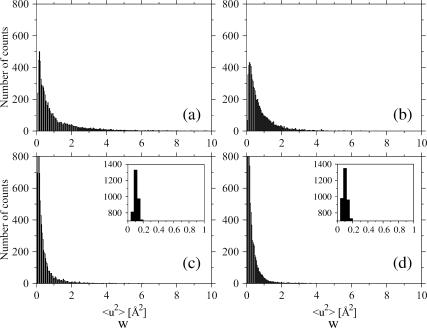
FIGURE 6.
Distributions of the mean-square displacements within blocks (Eq.7) for the two proteins: (a) Cβglu at 360 K, (b) Ssβgly at 360 K, (c) Cβglu at 300 K, and (d) Ssβgly at 300 K. Insets show the peaks of the distributions; note the different scales. Class intervals are chosen 0.038 Å2 tick.

