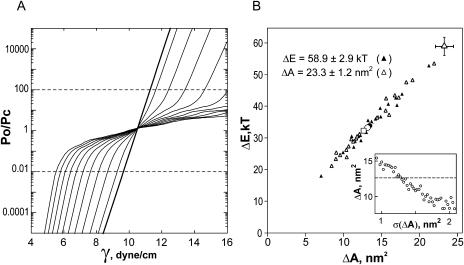
FIGURE A1.
Statistical simulations of tension responses of nonuniform channel populations. (A) Simulated population dose-response curves with fixed ΔEo = 58.9 kT and ΔA scattered ∼ΔAo = 23.3 nm2 with standard deviations σ(ΔA) varying from 0 to 10 nm2 (100 channels). (B) Simulated results (pairs of ΔAapp and ΔEapp) for 15 populations of 50 channels and 15 populations of five channels obtained either with varied ΔE and constant ΔA (▴), or varied ΔA and constant ΔE (▵). The inset shows the dependence of the mean ΔAapp on standard deviation σ(ΔA); the dashed line marks the experimental ΔA. The parameters and standard deviations denoted in B produce the mean ΔEapp and ΔAapp shown by ○ and • in the middle of each scatter. The □ represents the parameters observed in the experiment (same as in Fig. 5). The same populations as in B were simulated with both ΔE and ΔA parameters randomized around their mean values, which is illustrated in Fig. 7 B.

