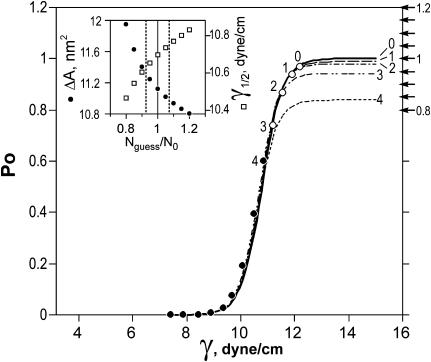
FIGURE A2.
Illustration of the accuracy of the dose-response curve-fitting procedure. The Po data from the trace presented in Fig. 1 A was truncated at different points (1–4), then fit with sigmoidal curves. Deviations of estimated Gmax values from Gmax determined from fitting the entire curve were assessed (see text). The upper limit of the fitting curve was then constrained to different levels deviating from the true Gmax by as much as 20% both ways (the discrete levels are indicated by arrows on the right side of the graph). Variations of ΔA and γ1/2 values obtained after introducing the errors in Gmax are presented in the inset. See Appendix 2.

