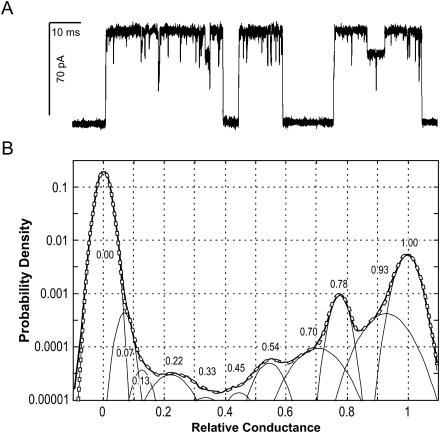
FIGURE 2.
Representative single channel currents of MscL recorded in a 30-kHz bandwidth from an inside-out patch at −20 mV (A). A 0.15-s fragment of a 5-min trace is shown with openings as upward deflections. The all-point amplitude histogram (B) compiled of 120 bins (solid envelope curve) includes the entire 5-min data set. It was fitted by a sum of 11 Gaussian distributions (dashed line). The peak positions shown by numbers represent amplitudes of subconducting states relative to the amplitude of the fully open state.

