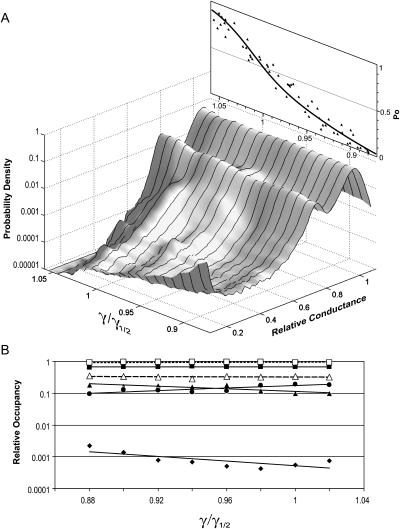
FIGURE 4.
Relative occupancies of the MscL conductive substates as a function of applied tension. (A) The three-dimensional amplitude histogram representing the probability of a single MscL channel to be in a particular conductive state at different tensions is compiled from 10 independent traces. The x axis indicates the magnitude of applied tension, γ, relative to the midpoint tension for MscL activation, γ1/2; the y axis shows the relative conductance of ion channel normalized to the conductance of the fully open state. The z axis displays the probability density in a logarithmic scale. The inset above is the plot of open probability (Po) versus γ/γ1/2, which represents a simultaneous fit of 10 dose-response curves with Eq. 1. (B) Occupancies of conductive states derived from amplitude histograms, as that in Fig. 2, recorded at different tensions (see Materials and Methods). Only the relative occupancies of S0.22 (♦), L0.78 (•), and S0.93 (▴) versus tension are presented. The combined relative occupancy of all nine substates together (▵) as well as occupancies of the fully open state (▪) remained practically constant over the range of tensions relative to the total occupancy of all conducting states taken as unity. The □ represents the effective amplitude of the integral current AIC, which is the sum of all substate occupancies multiplied by the corresponding amplitudes over the total probability of being open (see Appendix 2).

