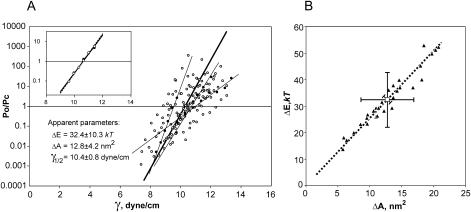
FIGURE 5.
Dose-response curves and apparent gating parameters of MscL. (A) Twenty-nine independent curves (10 from induced and 19 from uninduced patches) plotted as Po/Pc ratio versus membrane tension and fitted to the two-state model. Apparent parameters ΔE, ΔA, and γ1/2 were extracted from each fit, averaged, and presented as the mean ± SD. The thick solid line represents the curve with the average parameters. Thin solid lines are examples of individual curves with varying slopes. (Inset) Po/Pc versus tension plots obtained from the same trace with five active channels. ○ represent Po obtained from the integral current; • show Po determined using the amplitude threshold (0.1) detection technique. (B) Energies of MscL gating transition (ΔE) plotted against apparent protein area changes (ΔA) calculated from individual traces. Vertical, horizontal, and diagonal error bars represent standard deviations of ΔE, ΔA, and γ1/2 = ΔE/ΔA, respectively, around their mean values. Dotted line is the linear fit passing through the origin. Pirson's correlation coefficient of ΔE and ΔA values is 0.98.

