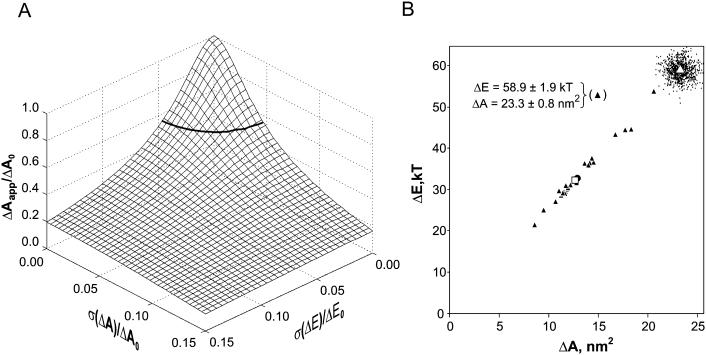
FIGURE 7.
Simulated tension responses of nonuniform channel populations. Intrinsic gating parameters based on the atomic models ΔEo = 58.9 kT and ΔAo = 23.3 nm2 were randomized with variable standard deviations. The combined dose-response curves for 100 channel populations were then computed and fit with Eq. 1 to obtain apparent parameters ΔAapp and ΔEapp. (A) A three-dimensional representation of ΔAapp/ΔAo as a function of relative σ(ΔA) and σ(ΔE). The surface illustrates that a 5% scatter of either parameter reduces ΔAapp to approximately one-half. (B) Simulated results for 15 populations of 50 channels and 15 populations of five channels in which both ΔE and ΔA were simultaneously varied around their mean values (cloud of small dots). Pairs of ΔE and ΔA are shown with ▴. The • in the center of the scatter shows mean values for ΔAapp and ΔEapp. The □ (overlapping with the circle) represents the mean parameters observed in the experiment (same as in Fig. 5). The values of standard deviations that closely reproduce the experimental scatter are denoted in B. See Appendix 1 for details of simulations.

