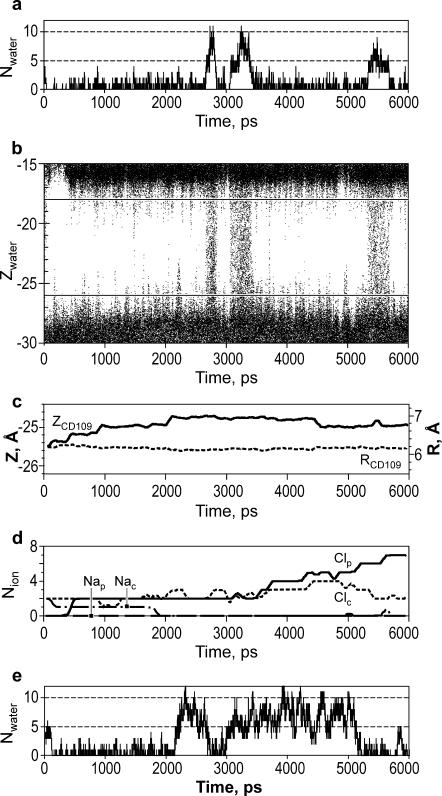
FIGURE 3.
Water occupancy of MscS pore during 6-ns simulations as a function of time. (a) The number of water molecules found in the narrowest pore region of WT MscS simulated in the presence of salt. (b) The z positions of water molecules in the pore region. Each point represents the position of a water oxygen at a given time step. Horizontal lines in b delineate the central region (−26 Å > z > −18 Å) where the water molecules were scored. (c) The average z coordinates of the terminal carbons of all seven L109 side chains (solid line) and their average distance from the axis of the pore (dashed line). (d) The average number of chloride and sodium ions in the periplasmic ( and
and  ) and in the cytoplasmic (
 and
and  ) halves of the pore. (e) The pore occupancy by water presented as in a for the simulation of WT MscS without ions.

