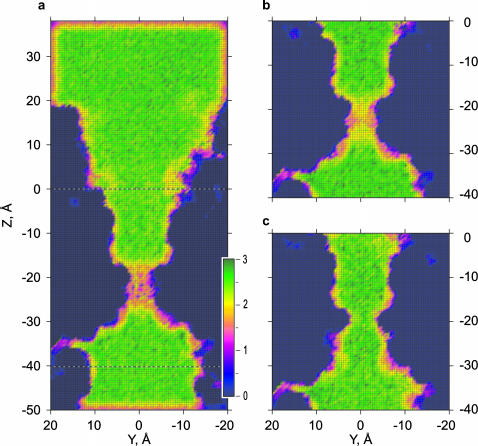
FIGURE 5.
Densities of hydrogen bonding in WT and GOF MscS. Hydrogen bonds defined by the geometric criteria (see Methods) were counted and averaged for entire simulations as in Fig. 4. The maps represent 2 Å slices along the pore axis through the center of the pore. (a) WT MscS simulated with 200 mM NaCl and (b) without ions. (c) L109S gain-of-function mutant simulated in the presence of salt, showing bulk-like density of H-bonds throughout the pore.

