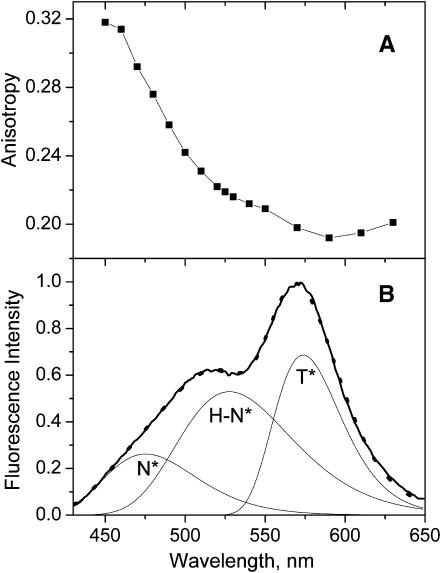
FIGURE 3.
Fluorescence studies of probe F in EYPC vesicles. (A) Spectrum of emission anisotropy. (B) Emission spectrum (solid line) and its deconvolution into N*, H-N*, and T* spectral components. The sum of deconvoluted bands (dots) matches closely the experimental spectrum. Concentration of probe and lipids were 1 and 200 μM, respectively, in 15 mM HEPES buffer, pH 7.4. Excitation wavelengths were 400 nm.

