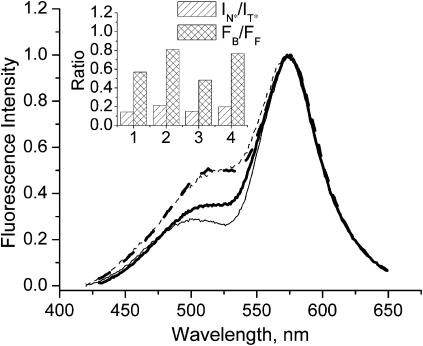
FIGURE 6.
Effect of phase transition on fluorescence spectra of probe F. Solid lines correspond to membranes in the gel phase composed of DMPC at 14°C (thin line, No. 1 of inset) and DPPC (thick line, No. 3 of inset); dashed lines correspond to membranes in the liquid crystalline phase composed of DMPC at 38°C (thin line, No. 2 of inset) and DLPC (thick line, No. 4 of inset). The spectra are normalized at the T* band maximum. Experimental conditions are as in Fig. 3. (Inset) Results of TBS analysis.

