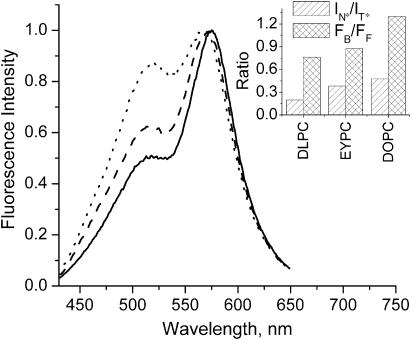
FIGURE 8.
Fluorescence spectra of probe F in LUV vesicles composed of lipids with various fatty acid compositions: DLPC (solid), EYPC (dash), and DOPC (dot). The spectra are normalized at the T* band maximum. Experimental conditions are as in Fig. 3. (Inset) Results of the TBS analysis.

