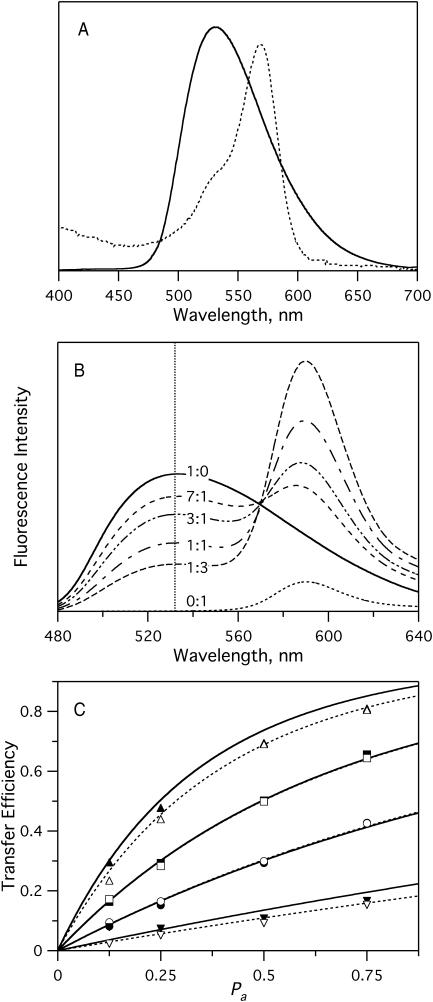
FIGURE 7.
FRET between NBD-PE and Rh-DOPE in multilamellar liposomes of pure bPC. (A) Spectral overlap of NBD-DOPE emission (solid) and Rh-DOPE absorbance (dashed). Dye concentration was 1% of the total lipid in both cases. (B) Example of a FRET experiment. Emission spectra with labels indicating the NBD-DOPE/Rh-DOPE ratio. Total dye concentration was 1%. Intensities were normalized to emission at 532 nm in the presence of 50 mM β-OG, where all FRET was relieved. (C) Comparison of experimental results to the model of Wolber and Hudson (1979). The plots show FRET efficiency versus Pa (mole fraction of dyes that are acceptors) in bPC vesicles with (▾,▿) 0.2%, (•,○) 0.5%, (▪,□) 1%, and (▴,▵) 2% dye. (For solid symbols, NBD-DOPE was the donor; for open symbols, NBD-DPPE was the donor.) Rh-DOPE was the acceptor in every case. Solid curves are calculated transfer efficiencies using known dye concentrations and Eq. 7. Dashed curves are least-squares fits of the experimental data to Eq. 7. Excitation was at 466 nm. All experiments were performed at 25°C.

