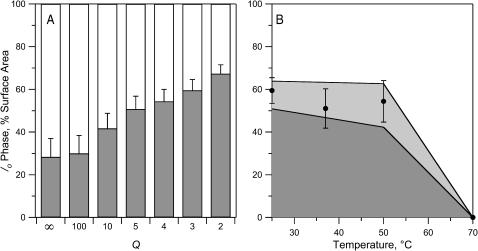
FIGURE 9.
Area fractions of lo phase lipid calculated from the data presented in Fig. 8 using Eqs. 8 and 10. (A) Area fraction of lo phase as a function of the ratio Q of DOPE-linked dyes in the ld phase divided by DOPE-linked dyes in the lo phase at 25°C. (B) Area fraction of lo phase as a function of temperature, assuming Q = 3. The lighter shaded area represents the area of uncertainty as delineated by least-squares fits to the extrema of the error bars of the first three data points.

