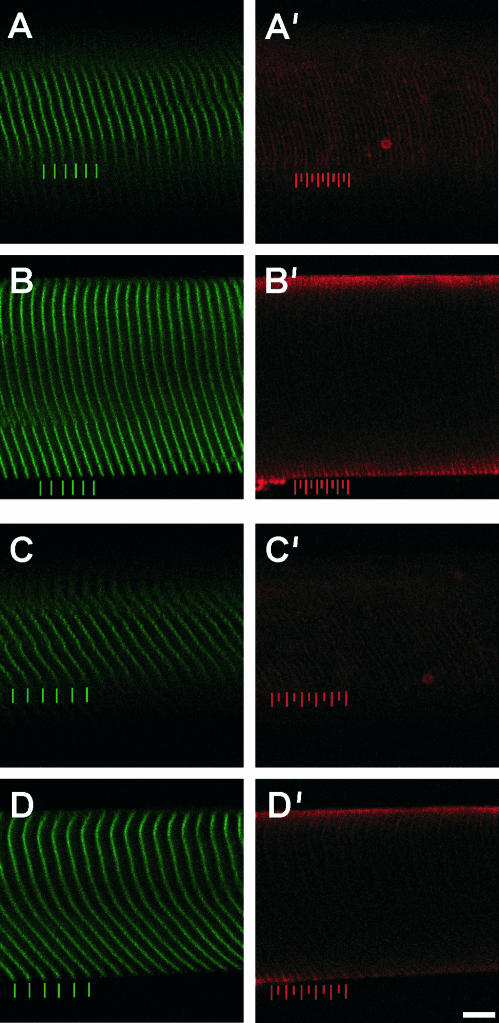
FIGURE 1.
Sample wild-type fibers double labeled for α-actinin and talin are displayed at two different strains. (A and B) Sarcomere length ∼2.80 μm. (C and D) Sarcomere length ∼3.60 μm. Left frames (A–D) show α-actinin labeling (green) and right frames (A′–D′) show talin labeling (red). Upper frames (A and C) show superficial optical sections and lower panels (B and D) show deep optical sections. Periodicity and relative displacement of intensity peaks (i.e., localization) were determined by FFT and AC functions. Colored bars represent positions of peak intensity. Scale bar, 10 μm.

