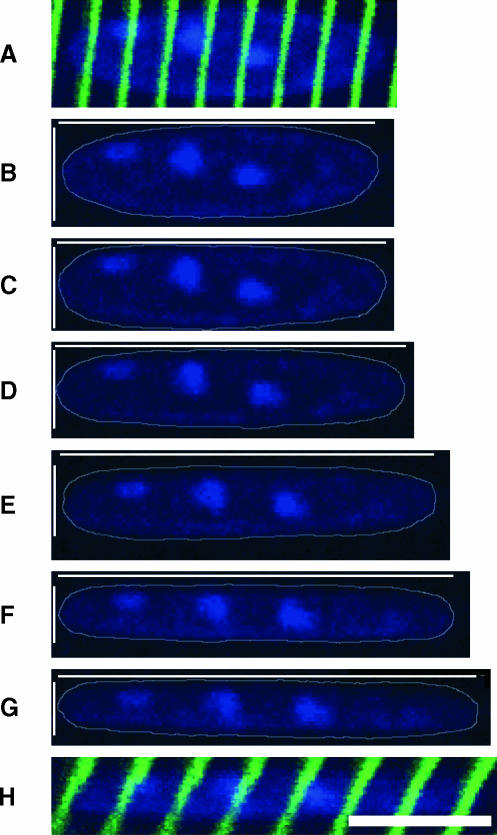
FIGURE 4.
Sample wild-type nuclear labeling displayed at increasing fiber strain. Top frame (A) shows an overlay of α-actinin label on an unstretched nucleus whereas bottom frame (H) shows an overlay of α-actinin label on a maximally stretched nucleus. Sarcomere lengths in the region of the nucleus, measured using AC/FFT, were (B) 2.70 μm, (C) 2.98 μm, (D) 3.26 μm, (E) 3.43 μm, (F) 3.72 μm, and (G) 3.99 μm. Thin white lines indicate nuclear length and width. Nuclei (blue) are outlined using thin gray lines. Note the constant relative position of individual Z-disks (green) with respect to the nucleus. Scale bar, 10 μm.

