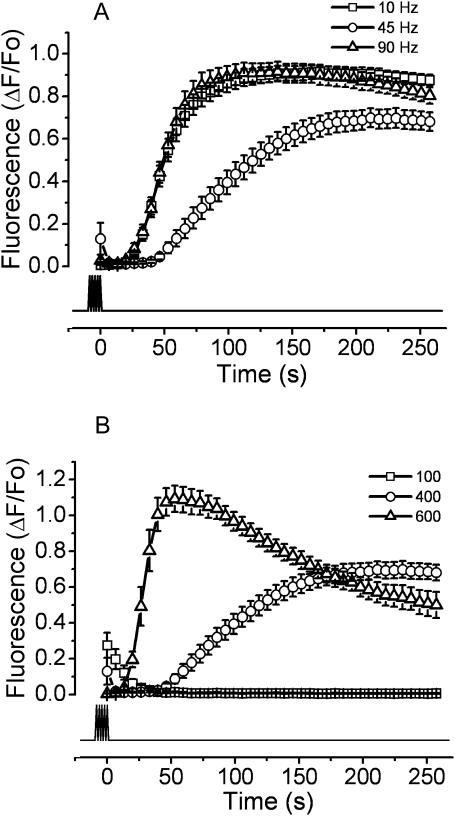
FIGURE 3.
Variations in the frequency or number of pulses modify the shape of the slow calcium signal. The following protocols of electrical stimulation were used. (A) Different frequencies: the cells were exposed to 400 pulses of 1 ms at 10 Hz (squares), 45Hz (circles), or 90 Hz (triangles). (B) Different number of pulses: myotubes were exposed to 100 (squares), 400 (circles), or 600 (triangles) pulses of 1 ms at 45 Hz. All experiments were performed in the absence of extracellular calcium (0.5 mM EGTA added). The mean of at least 12 independent experiments ± SE is shown. The lower trace shows the duration of the stimulus protocol.

