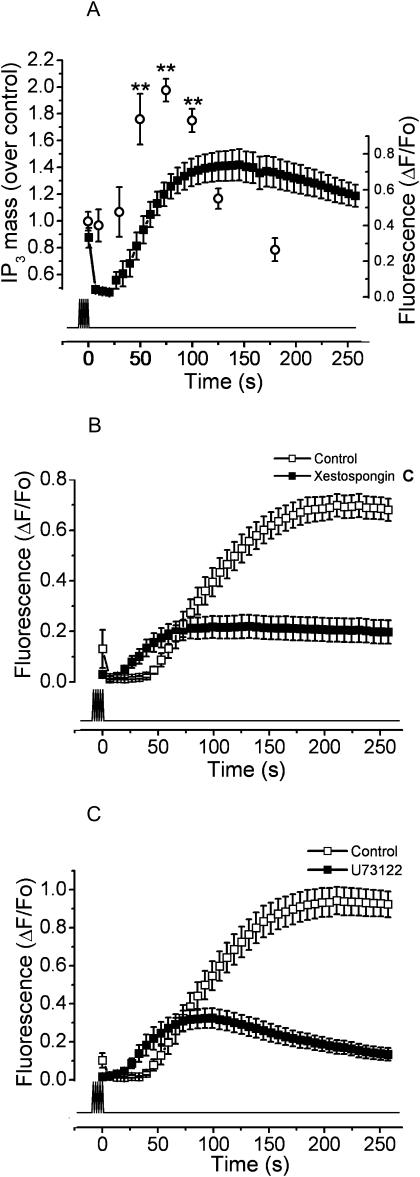
FIGURE 6.
PLC and IP3R are involved in the slow calcium signal. (A) The kinetics of IP3 production induced by electrical stimulation is shown (open circles). Myotube cultures were exposed to 400 pulses of 1 ms at 45 Hz. Then IP3 mass was measured as described in Materials and Methods. Each time point indicates the mean ± SE of three independent experiments. The difference in the response is statistically significant (**, P < 0.01) in comparison to the control condition. Superimposed is shown the slow calcium signal in the same temporal scale (solid squares) for the mean of 12 independent experiments ± SE for the same condition. (B) The slow calcium signal induced by electrical stimulation in the conditions described above was measured in the presence of the IP3R blocker xestospongin C (solid squares); the control condition in the absence of extracellular calcium (0.5 mM EGTA) is shown (open squares). The mean of at least 12 independent experiments ± SE is shown. (C) Inhibition of the slow calcium signal in the presence of the PLC inhibitor U73122 (solid squares). The signal obtained for the control condition is also shown (open squares). In each case, the mean of at least 12 independent experiments ± SE is shown. The lower trace indicates the timing for the stimulation protocol.

