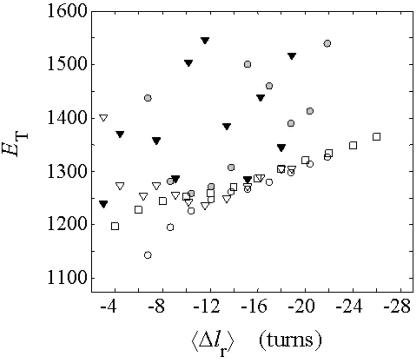
FIGURE 9.
Twist energy parameter, ET, versus residual linking difference of the duplex region. The solid or shaded symbols apply to  values that are determined from the
  and
and  of the simulated molecules according to Eq. 19. These
  values apply for n = 1 (shaded circles) or n = 2 (▾) melted subunits. The open symbols represent the same
  values that appear in Fig. 8 for n = 0 (□), n = 1 (○), or n = 2 (▿) melted subunits out of 155 total subunits.

