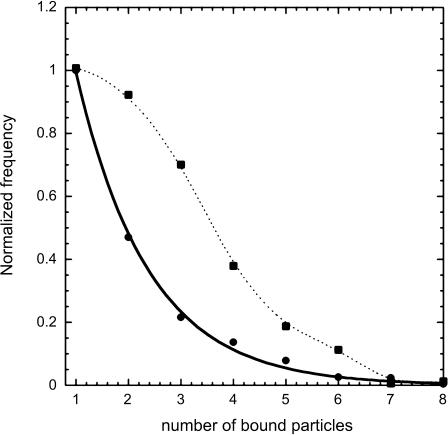
FIGURE 12.
Distribution of the number of particles per cell. The number of cells, ni, in each subpopulation of cells bearing i particles was plotted as a function of i, for experiments performed with (▪) or without (•) 0.1% sodium azide. The normalized frequency for a subpopulation of cells bearing i particles is equal to  where νmax is equal to the highest frequency of the sample.

