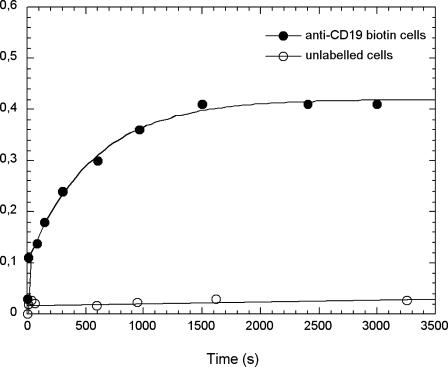
FIGURE 4.
Cells and particles interaction kinetic profile. The ratio of the number of cells having acquired enhanced fluorescence, i.e., located in the upper quadrant of the FL3 dot-plot (see Fig. 3), to the total number of living cells has been plotted as a function of time of contact with the particles. Cells had previously been labeled (•) or not (○) with biotinylated anti-CD19. Same experimental conditions as in Fig. 3.

