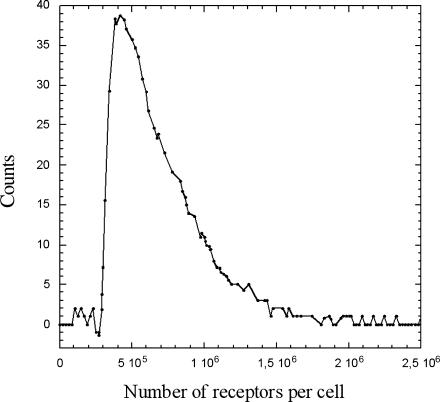
FIGURE 7.
Receptor density cutoff for the binding of a particle, obtained after subtraction of the particle-free cells distribution to the total cells distribution, normalization of each histogram to the same number of cells, and multiplication of each by their respective mean frequency, i.e., 0.4 and 0.6.

