FIGURE 8.
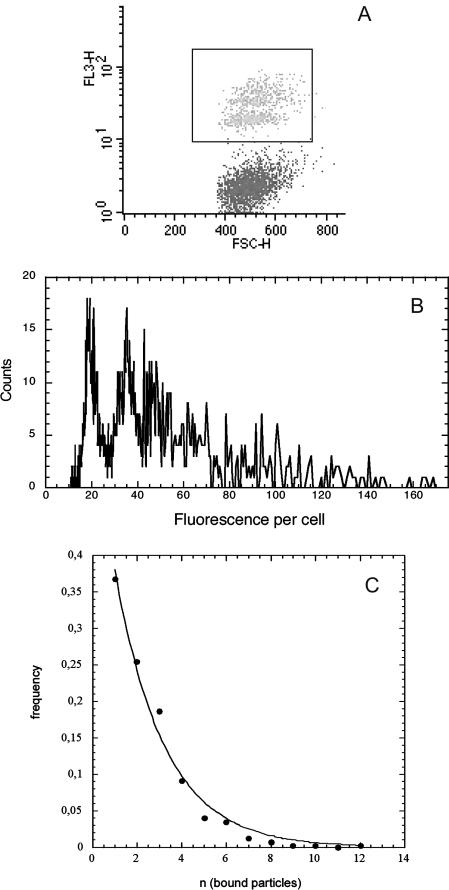
Number of bound particles per cell: the cluster of the cells having bound particles (black frame) was selected on the biparametric dot-plot (A), at the kinetic plateau of the binding (same experimental conditions as in Fig. 2). Its fluorescence distribution was plotted according to a linear scale (B), which allowed resolving discrete populations of cells according to their bound-particles' number. The fluorescent increment per bound particle was found equal to 17 arbitrary units. The number of cells per subpopulation (with 1, 2, 3, … , n particles) was counted and plotted as a function of n, the number of bound particles per cell (C). The experimental points (•) were adjusted to an exponential decay (—) of the form ν(n) = p × e−δ×n.

