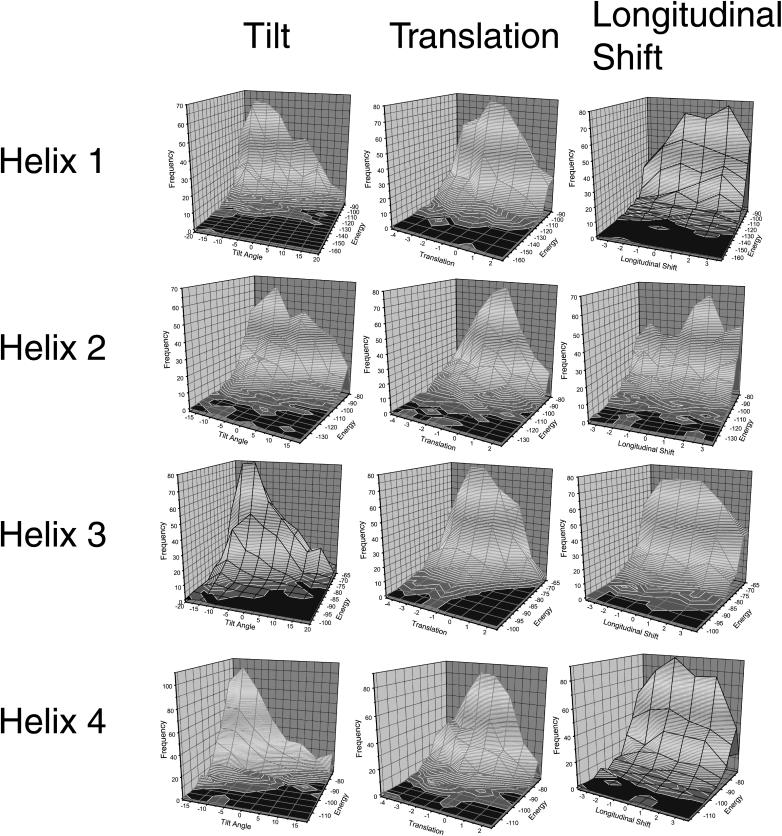
FIGURE 3.
Tilt, translation, and longitudinal shift of EmrE. For each of the helices, the 1000 lowest energy conformations were further evaluated by a frequency analysis. For this analysis, a three-dimensional histogram with the frequency on the z axis, the energy on the y axis, and the respective structural parameter on the x axis has been generated. The distribution for tilt angle, lateral translation, and longitudinal shift for each of the helices are shown here. The maximum values were assumed to be near-native values. The conformation of the respective helix was then changed according to these values.

