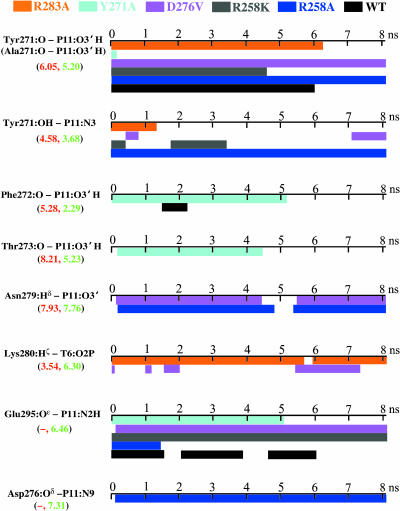
FIGURE 7.
Time evolution of some important hydrogen bonds and van der Waals contacts between protein and DNA nascent basepair for dynamics simulations of R283A (orange), Y271A (cyan), D276V (pink), R258K (gray), and R258A (blue) over 8.1 ns, and of wild-type (black) over 6 ns. The values in parentheses indicate the distance (in Å) between two heavy atoms in each pair of corresponding interactions in the closed (red) and open (green) states of the crystallographic pol β/DNA complexes; and the hyphen (–) indicates not applicable.

