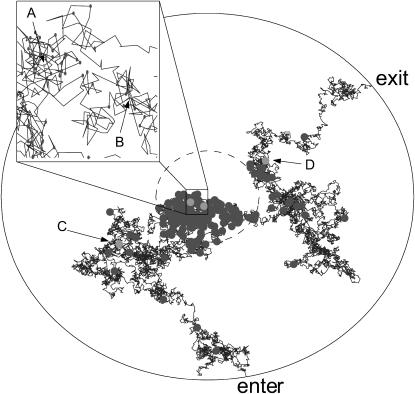
FIGURE 1.
Data generated by two-dimensional simulation. The plot shows a trajectory of a molecule with Dj = 0.25 μm2/ms and mj = 1 through the circular region centered at the laser focus with radius Rmax = 2 μm. The inner, dashed circle represents the laser beam waist. Entry and exit points are indicated. Displayed molecule positions are updated in 0.5-μs increments. Circles indicate the molecule's position at each photon arrival time. Labeled points correspond to the times at which the distributions in Fig. 3 are shown.

