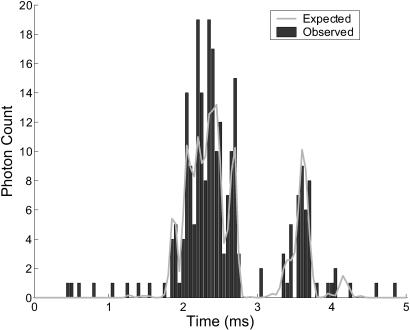
FIGURE 2.
Simulated photon counts detected in time intervals of 50 μs as the molecule traversed the path in Fig. 1. Also shown is the expected photon count over these intervals based on the actual laser intensity at the molecule's position, given by Eq. 7. Note the difference between expected and detected fluorescence rates—this contributes to the difficulty of extracting accurate spatial information from the photon stream.

