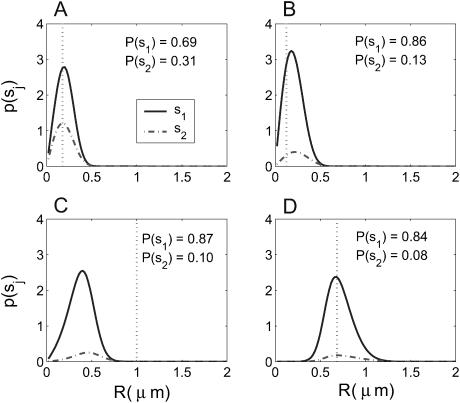
FIGURE 3.
Sample spatial distributions resulting from the stream of 253 photons presented in Fig. 2, using S = {(1, 0.25), (1, 0.5)}. The distribution after the 62nd photon detected (point A in the trajectory) is in the top left. The top right, bottom left, and bottom right distributions are after the 125th, 188th, and 252nd photons, with the molecule at positions B, C, and D, respectively. Integrated probabilities given by Eq. 4 are reported for each species. Dotted vertical lines indicate the actual radial position of the molecule.

