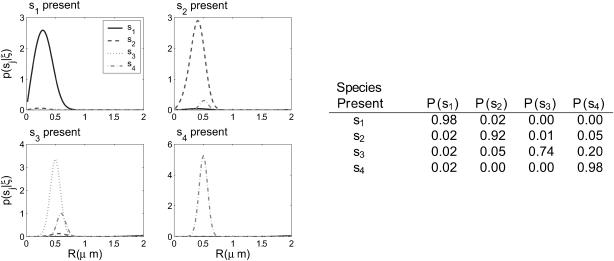
FIGURE 7.
(Left) The performance of the recursive estimator in a high diffusion coefficient ratio multiple component experiment with S = {(1, 2), (1, 0.4), (1, 0.08), (2, 0.08)}. Trajectories were generated for each species, and the resulting photon arrival-time data was run through the estimator. The distributions shown are the distributions before the final exit time of the molecule for each trajectory. (Right) The table shows the integrals of the probability distributions shown in the figure, giving the probability of each species being present according to the data generating each plot.

