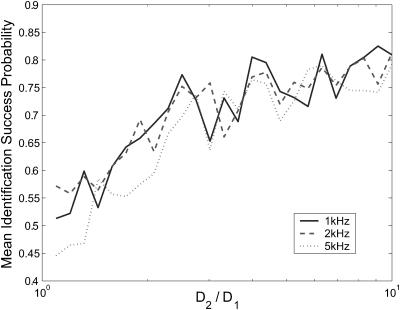
FIGURE 9.
Performance of the arrival-time estimator on data with varied background noise strengths indicated. The plots were generated using S = {(1, 0.1), (1, D2)}, and 0.1 < D2 ≤ 1.0, with a minimum of 200 identifications made for each species. Data shown are the geometric means of the success probabilities for each species.

