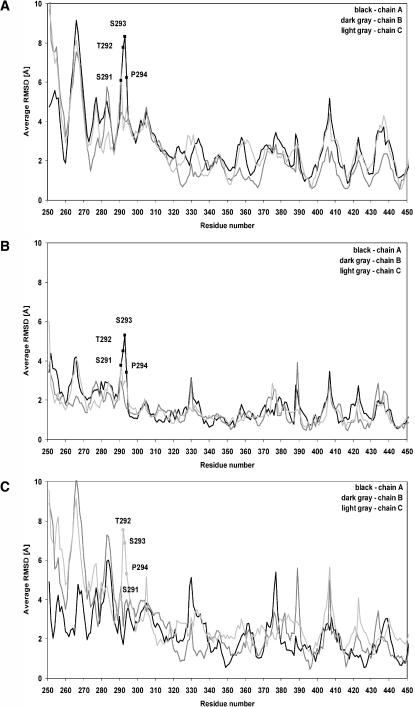
FIGURE 5.
RMSD values of all σ1 amino acids. (A) Average RMSD values of the backbone atoms of each amino acid from the minimized crystallographic structure within the simulation interval 1–2 ns. (B) Average RMSD values of the backbone atoms of each amino acid from the minimized crystallographic structure within the simulation interval 2–3 ns. (C) Average RMSD values of the backbone atoms of each amino acid from the minimized crystallographic structure within the simulation interval 3.5–4.5 ns.

