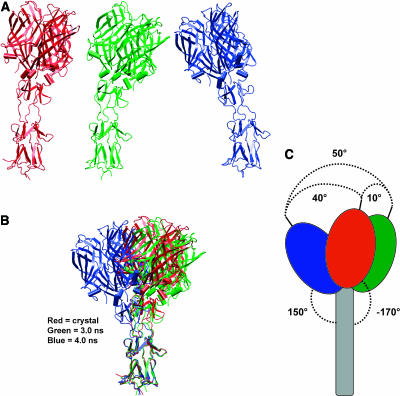
FIGURE 6.
The basis of σ1 flexibility. (A) The σ1 crystal structure (red) and snapshots at 2.5 ns (green) and 4 ns (blue) from the ASH345-based MD simulation. (B) Superimposition of two snapshots representative of the overall protein dynamics onto the crystallographic structure of σ1. The three-dimensional alignment was accomplished by fitting the backbone atoms of amino acids (255–288) of the σ1 tail. (C) Schematic representation of the three superimposed structures. Angle values were defined by first estimating the centers of mass (centroids) of the protein head, tail, and head-tail junction. The axes of both head and tail were defined as the segments connecting the head centroid to the head-tail centroid, and from the tail centroid to the head-tail centroid, respectively. The oscillating movement was estimated as the angle between the head axis of two different snapshots (maximum value of ∼50° was calculated between a snapshot at 2.5 ns and a snapshot at 4 ns). The bending down movement of the head was defined as the angle between the head and tail axes (maximum calculated value ∼150°).

