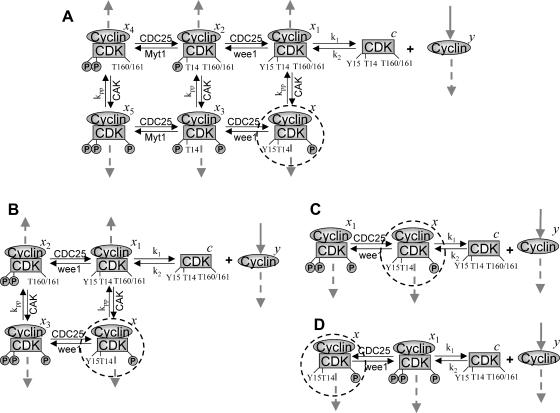
FIGURE 1.
Models of the signal transduction network for CDK regulation. (A) Signaling network of the full model. (B) Signaling network of simplified Model A. (C) Signaling network of simplified Model B. (D) Signaling network of simplified Model C. The thick solid arrows indicate cyclin synthesis and dashed arrows indicate cyclin degradation. Labels refer to the variables used in the differential equations (Appendix) for each monomer and dimer. Rate constants for CDC25, CAK, wee1, and Myt1 phosphorylation and dephosphorylation of CDK are denoted as kcdc25, kcak, kwee1, and kmyt1, and other rate constants are as indicated.

