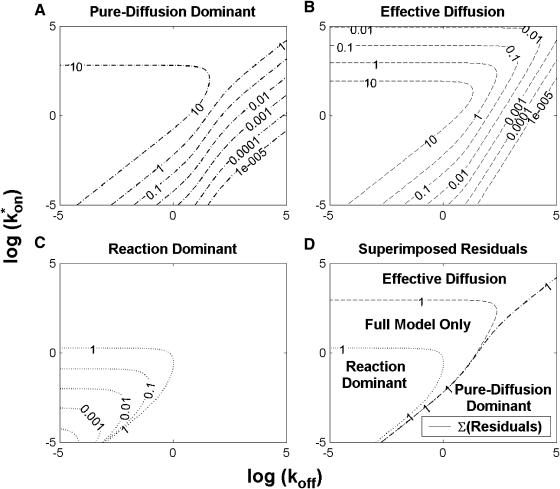
FIGURE 2.
Contour plots of model fits. For each idealized model, a contour plot of the sum of residuals between the idealized model and the full model demonstrates the degree of fit as a function of  and koff (Df = 30 μm2/s, w = 0.5 μm). (A) The pure-diffusion dominant model results in a good fit (i.e., the sum of residuals becomes small) as
  becomes small relative to koff (lower-right corner). (B) The effective diffusion model domain is made up of the pure-diffusion dominant regime plus the area with large values of
  (C) The reaction dominant model matches the full model when both
  and koff are small (lower-left corner). (D) Superimposing the contour lines of the sum of residuals equal to 1 from parts A–C reveals the domains for each idealized model, as well as a region where none of the idealized models fit (full model only).

