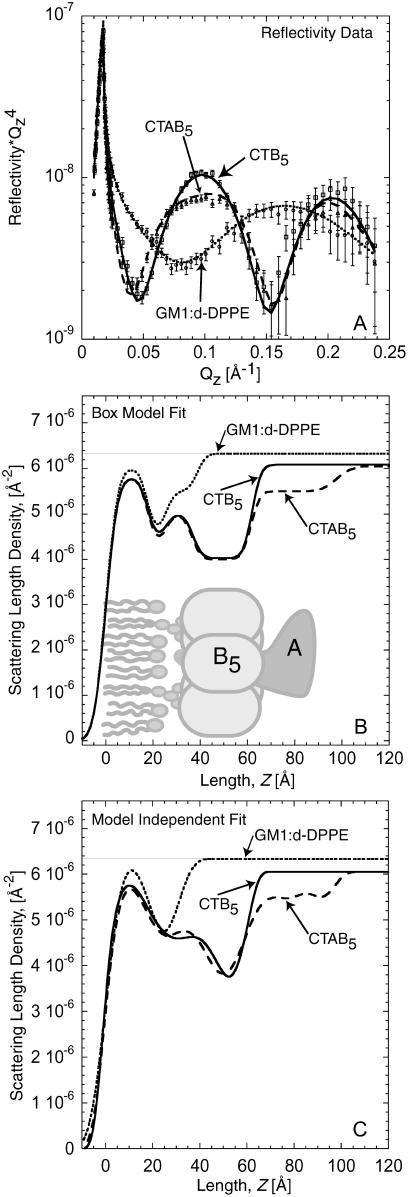
FIGURE 1.
(A) Neutron reflectivity of the monolayer, monolayer with bound CTB5, and monolayer with bound CTAB5. Points with error bars are measured data. Solid and dashed lines indicate fits to the data corresponding to the scattering length density profile in B. (B) Scattering length density profile of box model fits shown in A. A detailed schematic of the box model is provided in Fig. 2. In the profile for the monolayer, the lipid tail, head, and saccharide regions are clearly distinguishable. When CTB5 and CTAB5 are bound, the structure of the lipid monolayer is not significantly altered. The decrease in scattering length density (β(z)) of the lipid tail and headgroup regions is due to an increase in the area per molecule consistent with geometrical constraints applied when cholera toxin binds GM1. The A-subunit clearly resides below the B5 pentamer, facing away from the lipid layer. (C) β(z) profile from the cubic β-spline fitting routine. Reflectivity fits are not shown in A for clarity, but were slightly better than the box model fits. The β(z) profiles from both fitting methods are very similar, suggesting that the real-space structure from the box model fits is reasonable. Note: The difference in the β(z) of the subphase is due to the small addition of H2O used for solvating the protein before incubation with the monolayer.

