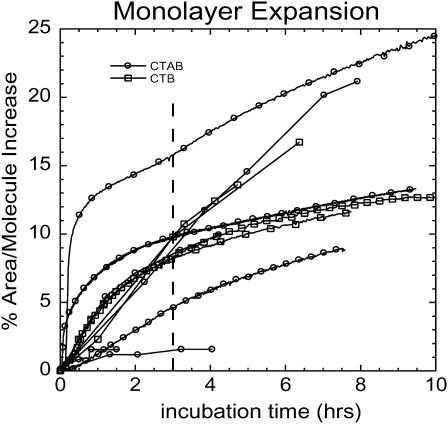
FIGURE 3.
Area expansion curves of the GM1-DPPE monolayer after CTAB5 or CTB5 has been added. There are variations in the % area expansion between experiments. The 8 ± 5% expansion reported is a result of 11 independent experiments for CTAB5 and CTB5 after 3 h of incubation (indicated by a dashed line). There error of ±5% refers to the standard deviation of the values at 3 h of incubation. There is no trend showing more expansion for CTAB5 or CTB5.

