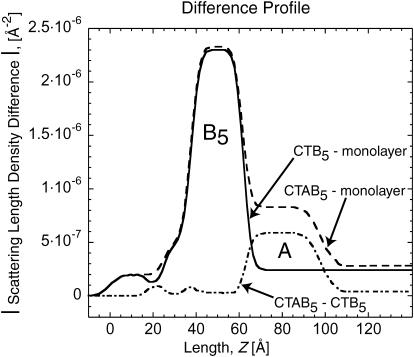
FIGURE 4.
Scattering length density difference profile of NR measurements done on D2O buffer subphase. In the CTB5-monolayer case, the B5 unit can be seen along with differences in the lipid region. In the CTAB5-CTB5 case, the A-unit can clearly be seen to be oriented away from the lipid layer. There is little-to-no change in the lipid region when CTB5 and CTAB5 are bound implying that there is little to no A-unit penetration before activation.

