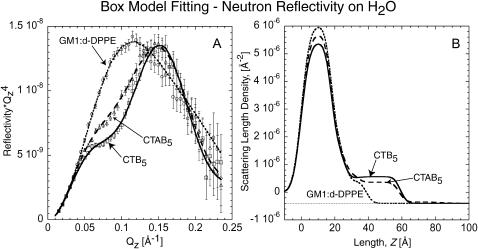
FIGURE 5.
Neutron reflectivity with H2O as the subphase instead of D2O. (A) Neutron reflectivity of the monolayer, monolayer with bound CTB5, and monolayer with bound CTAB5. Solid and dashed lines indicate the fit corresponding to the profile in B. Points with error bars correspond to measured data. (B) Scattering length density profile of fits shown in A obtained by box model fitting methods. The same features of lipid tails, lipid heads, and the B5 subunit can be seen. The A-unit of CTAB5 is not very visible due to small contrast between the scattering length density of H2O and the A-unit layer. These results are consistent with that of NR done on D2O. The difference in β(z) of the lipid tail region for bound CTAB5 and CTB5 is most likely due to different protein coverage. The increased amount on CTB5 coverage (indicated by a larger β(z) for Box 4) is responsible for a larger decrease in lipid tail β(z) due to a larger increase in area per molecule of the lipid layer.

