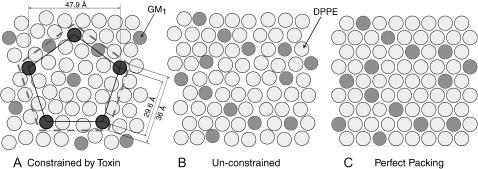
FIGURE 8.
Lipid packing arrangements generated from Monte Carlo simulations (see also Fig. 7). GM1 molecules are represented by dark disks with an area of 40 Å2 and DPPE (lighter disks) molecules with an area of 45 Å2 (Majewski et al., 2001). (A) Simulation result: When CTB5 binds, it constrains up to five GM1 molecules (shown darker that other GM1 molecules) at protein binding site locations. The corners of the inner pentagon represent these binding sites. The larger dashed pentagon represents the area of one toxin molecule. When 55 out of 200 GM1 lipids are fixed by protein binding (∼50% coverage) the result is a 7% decrease in lipid packing density (see text for further details). This decrease in lipid packing density is consistent with the observed monolayer area expansion at a constant surface pressure of 20 mN/m. (B) Simulation result: Shows an 80:20 DPPE:GM1 monolayer at 20 mN/m in the absence of protein binding (no constraints). (C) Shows perfect packing of the monolayer for reference.

