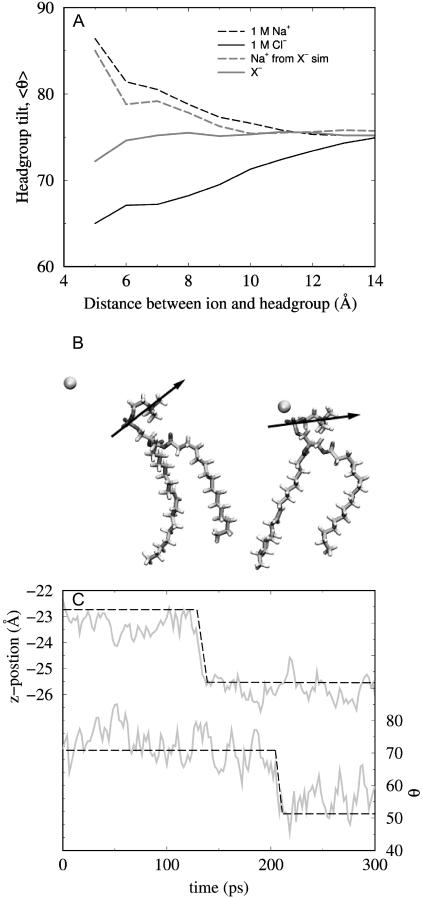
FIGURE 4.
Effect of ionic approach to the headgroup. (A) Trajectory averaged angle (θ) between the bilayer normal and the PN dipole (0° ≡ dipole straight out into the aqueous phase; 90° ≡ dipole parallel to the bilayer plane) for lipids with a Na+ (dashed lines) within a certain distance of the headgroup P or anion (solid lines) within a certain distance of the headgroup N, from the 1 M NaCl simulation or the NaX simulation. (B) Two snapshots taken from the 1 M NaCl simulations illustrating the effect of Na+ approach on the headgroup tilt, taken 250 ps apart. (C) Dynamic changes in z position (top) and headgroup angle (bottom) for one Na+ from the 0.25 M NaCl simulation showing a correlated transition as the ion departs the headgroup region. Dashed line has been added to highlight the transition.

