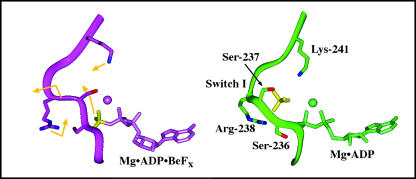
FIGURE 4.
Protein and ligand movements in the active site and back door regions during a 200-ps simulation based on the MDdc·Mg·ADP·BeFx protein conformation. The movements of ADP·Pi, protein, side chains, and the switch 1 backbone during the simulation are represented by gold arrows on the MDdc·Mg·ADP·BeFx structure (purple). Note that the BeFx (left) and Pi (right) moieties are colored yellow for clarity. The average structure of the last 5 ps of the simulation is shown in green. As Pi moves away from ADP, it causes switch 1 to bulge into the 50-kDa cleft. Arg-238 and Lys-241 then swing into the γ-phosphate-binding site to coordinate Pi in its new position. Mg2+ is represented by a sphere in both structures.

